Visualizing Geotagged Tweets
Visualization of real-time geotagged tweets. This projects has two main components, the server and the client application.
Server
The server uses Twitter Streaming API, Socket.IO and Node to capture geotagged tweets in real-time. The server receives topics from the connected clients and send them the tweets matching the topics.
Client
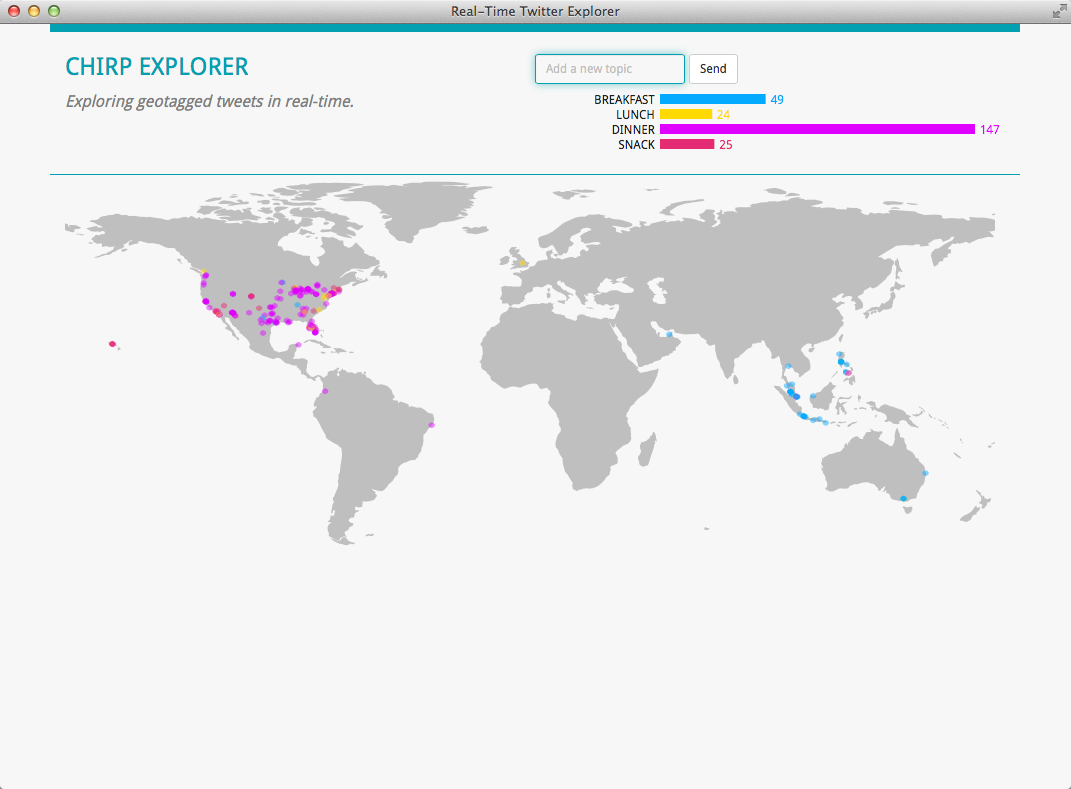
The client applications displays a map showing the location of the tweets matching each word given by the user. It also includes a small bar chart that updates as the tweets arrive.

This project is an example included in my book Mastering D3.js, published by Packt in August 2014.