Earthquakes in Chile since 1900
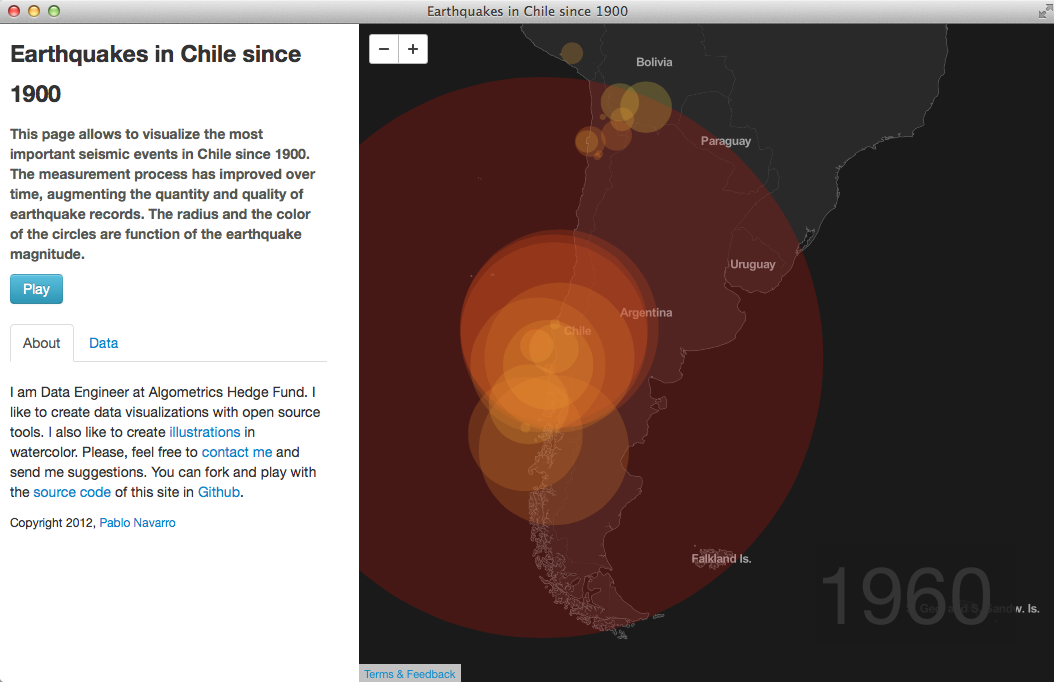
A timelapse animation of the most important seismic events in Chile since 1900. Each earthquake is represented with a red bubble centered in the epicenter, the area of the circle, color and duration of the bubble are proportional to the earthquake magnitude.
This project was made with D3, Mapbox and Bootstrap. Mapbox uses open data from OpenStreepMap and its contributors.
The earthquake data was retrieved from the ANSS Composite Catalog and joined with the Centennial Catalog from the USGS. Thanks to the USGS, to the Advanced National Seismic System (ANSS) for providing the catalog and to the Northern California Earthquake Data Center (NCEDC) and to the organizations that contributed the data to the NCEDC.