Creating a Simple Map
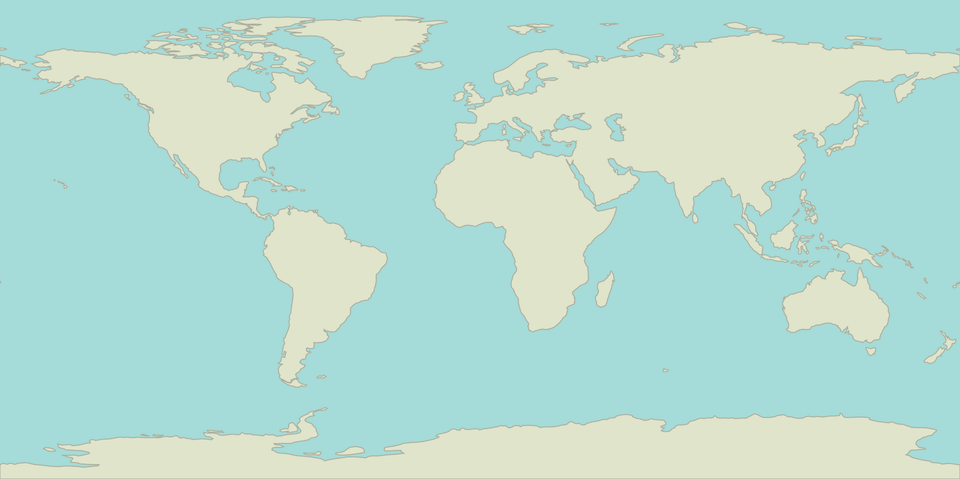
We will start by reviewing the process of creating a simple SVG map with D3. This map uses an existing GeoJSON file that contains only one geographic feature, the land on the planet.

The code that generates the image is available at Block: Simple Map with D3. Before discussing the code, let’s examine the resulting image.
<svg width="960" height="480">
  <path class="land" d="M321.14,453.44 ..."/>
</svg>
The path element has two attributes, its class and the d attribute, which contains the instructions to draw the land. Fill and stroke colors are defined using CSS
<style>
svg {
  background-color: #A7DBD8;
}

.land {
  fill: #E0E4CC;
  stroke: #ACAF9F;
  stroke-width: 1;
}
</style>
The process of creating SVG maps with D3 is always a variation of the following steps. We will discuss the process before going into the details of each one.
- Prepare the SVG Element
- Load Geographic Data
- Create the Projection
- Create the Path Generator
- Create the Path Elements
Preparing the SVG Element
Before doing anything else, we need to create an SVG element to contain the groups and paths that will contain the features. We can create maps using canvas as well, but let’s focus on SVG.
// Create a selection for the container div and append the svg element
var div = d3.select('#map-container'),
    svg = div.selectAll('svg.map').data([0]);

svg.enter().append('svg')
  .classed('map', true);

// Set the size of the SVG element
svg
  .attr('width', width)
  .attr('height', height);

svg.exit().remove();
Sometimes the SVG element will be already present, we might also want to create the SVG element when we get the geographic data. From this point on, let’s just assume that the SVG element exists.
Note that the size of the SVG container is important, as different projections will need different aspect ratios. In this case, we will use the equirectangular projection, so a 2:1 rectangle will be perfect.
Loading Geographic Data
There are two main file formats for this, GeoJSON and TopoJSON. We will discuss the formats later, but let’s just say that we have a GeoJSON file for now (the land.json file).
// Retrieve the geographic data asynchronously
d3.json('land.geojson', function(err, data) {

  // Throw errors on getting or parsing the file
  if (err) { throw err; }

  // Create the map here...

});
The d3.json method is asynchronous, this means that the callback method will be called once the request for the file land.geojson is either fulfilled or fails, and that the code after the call will execute right away. Learn about other D3 methods to make requests.
Creating the Projection
The path generator will calculate the path string that describe the land shape, but before, we need to create and configure a geographic projection. A geographic projection is a function that takes geographic coordinates longitude, latitude and returns coordinates x, y on a plane, let’s say in pixel coordinates.
There is a huge number of geographic projections, none of them are accurate, but some of them have some properties that make them practical to represent different aspects.
Projections on D3 are configurable functions, we can set their attributes by chaining accessor methods and passing them the corresponding values.
// Create and configure a geographic projection
var projection = d3.geo.equirectangular()
  .translate([width / 2, height / 2])
  .scale(width / (2 * Math.PI));
This projection is great for some reasons, it’s easy to compute and the world is represented as a 2:1 rectangle, very convenient for laying it out in print or web pages. For most of our maps, this is all we need to know about projections.
Path Generator
The geographic path projection is similar to SVG path generators, is a function that takes data in a certain format (in this case, GeoJSON) and returns a SVG path string. The path generator needs to know the projection to compute the SVG path string.
// Create and configure a path generator
var pathGenerator = d3.geo.path()
  .projection(projection);
The path generator will have a reference to the projection function, if we change the projection parameters we won’t need to update the path generator.
Creating the Path Element
With the path generator set up, we can go back to regular D3, create a selection for the path, use the enter, update and exit selections and use the path generator to set the d attribute.
// Create a selection for the path elements and bind the
// geographic data to the selection
var land = svg.selectAll('path.land').data([data]);

// Append the path element on enter and set its class
land.enter().append('path')
  .classed('land', true);

// Use the path generator to convert from GeoJSON to SVG string
land.attr('d', function(d) { return pathGenerator(d); });

// Remove the path element on exit
land.exit().remove();
This is the gist of creating a SVG map with D3. Of course, there are many things we can do to improve this map, add interaction and improve the map, performance and rendering in several ways.