Geographic Projections
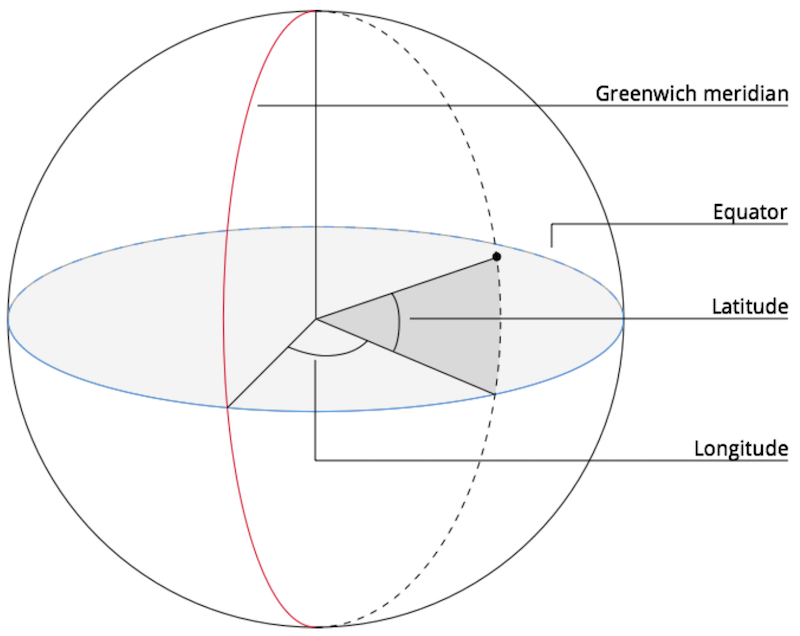
Positions on the surface of the Earth are described by two angles, longitude and latitude. The longitude of a point on the surface of Earth is the angle between that point, the axis of Earth and an arbitrary reference line known as the Prime meridian (Greenwich), the latitude is the angle between the point, the center of Earth and the Equator.
To be able to represent shapes on the surface of Earth on a plane, we need a systematic way associate geographic coordinates longitude, latitude to coordinates in a plane. A function that does this is called a cartographic projection.
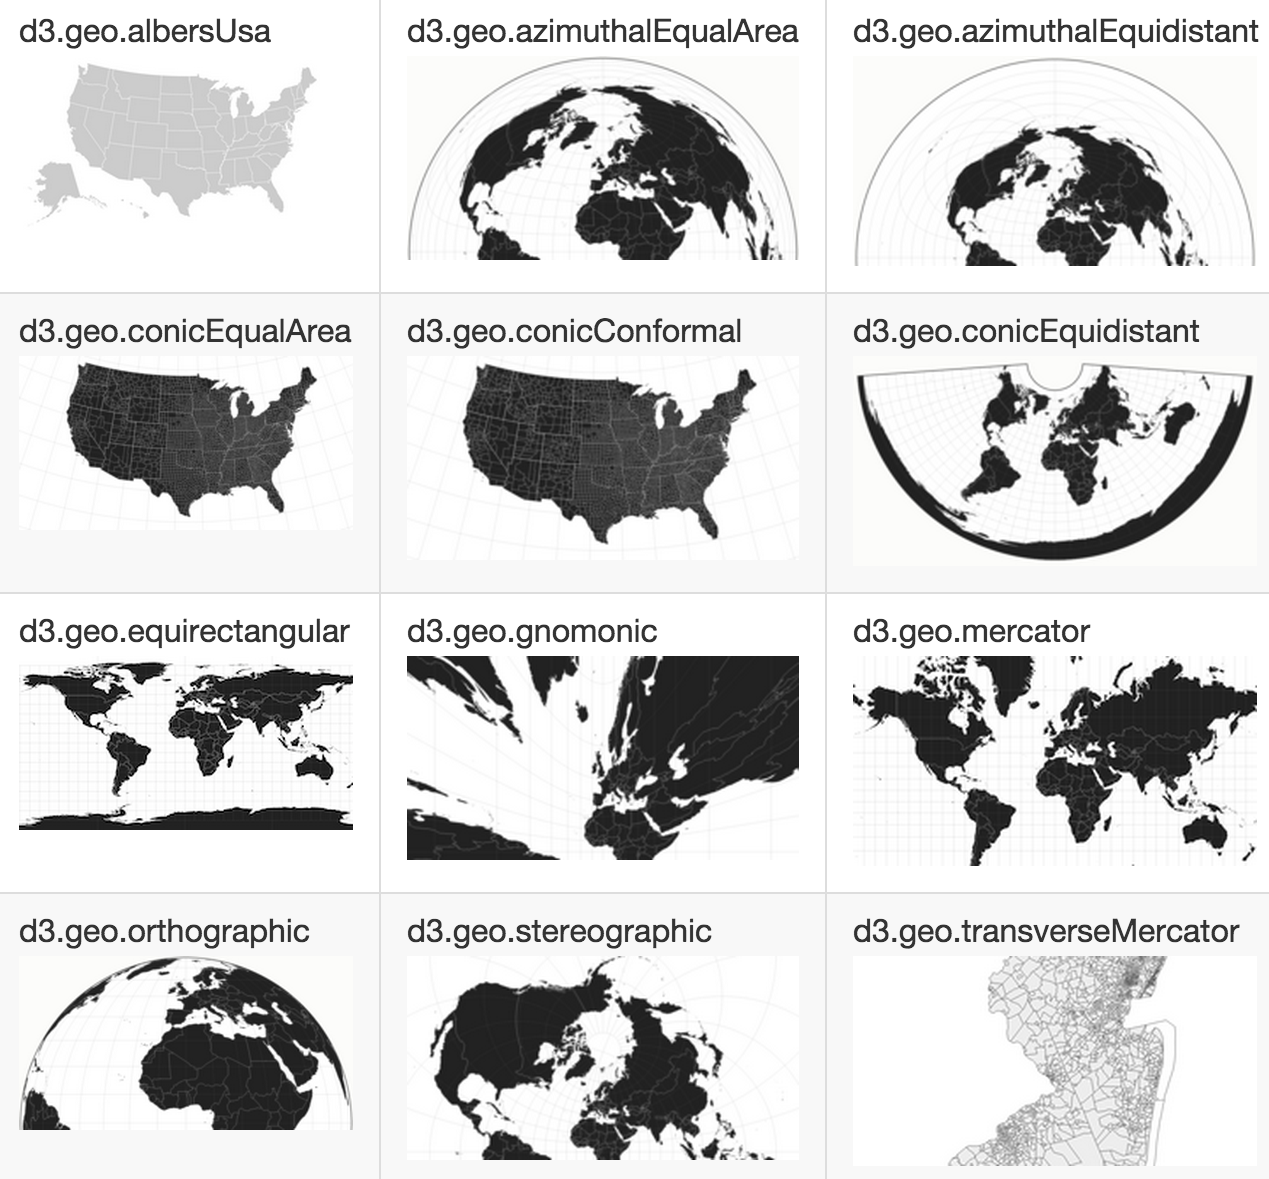
D3 comes with a set of configurable geographic projections, less commonly used projections are available in the extended geographic projections plugin and the polyhedral projection plugin.
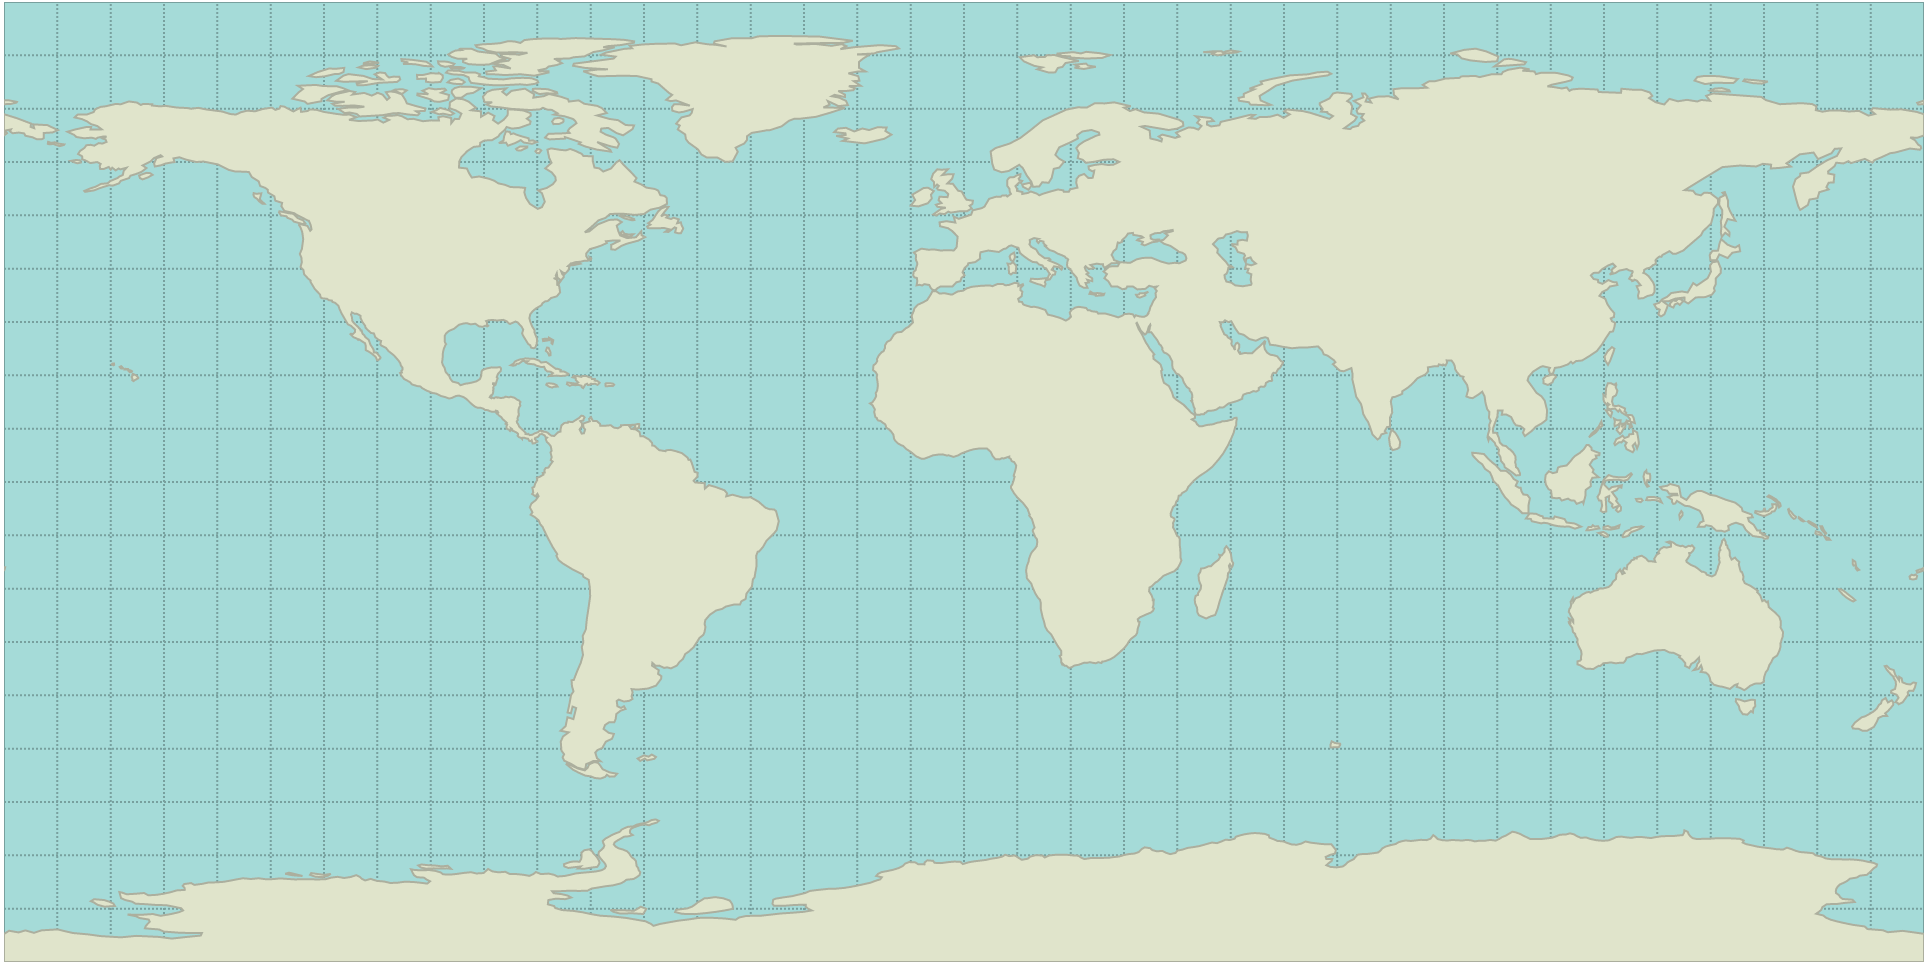
Equirectangular
Block: Equirectangular Projection
// https://github.com/mbostock/d3/blob/master/src/geo/equirectangular.js
function d3_geo_equirectangular(λ, φ) {
  return [λ, φ];
}
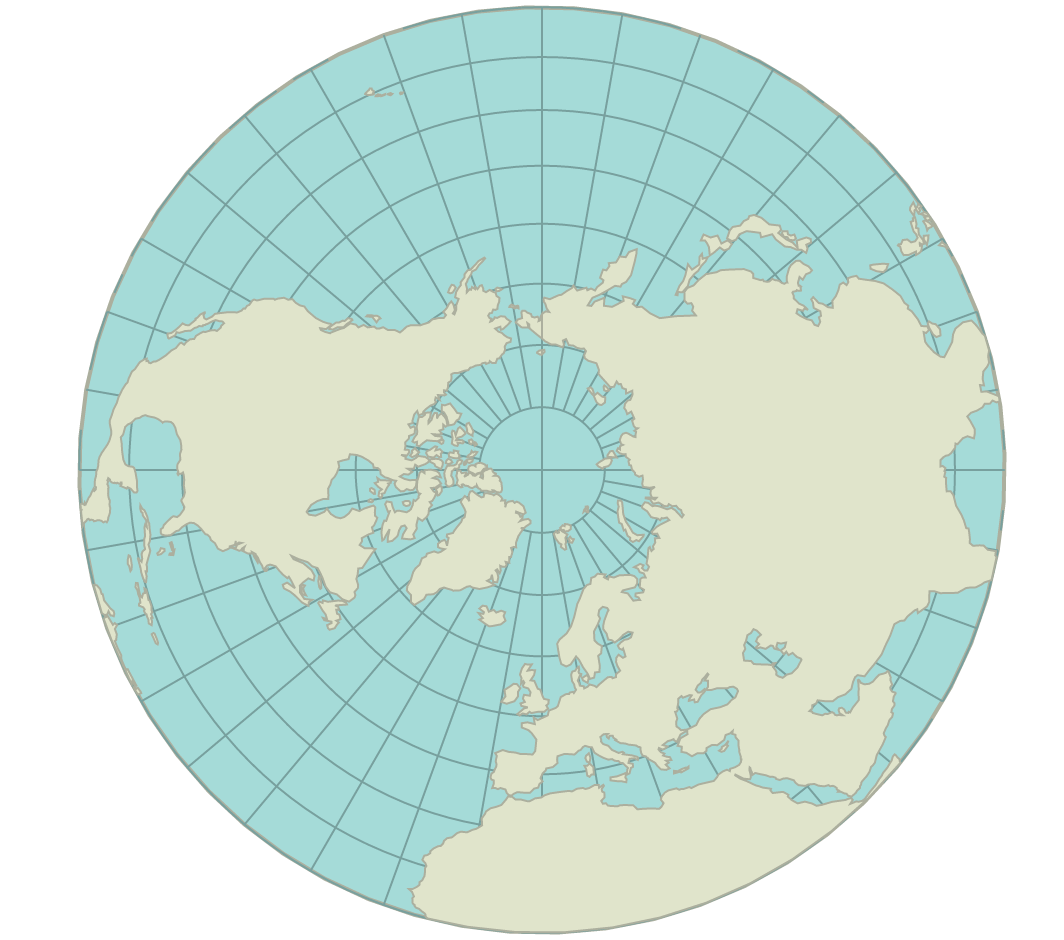
Azimutal Equal Area
// Abstract azimuthal projection.
// https://github.com/mbostock/d3/blob/master/src/geo/azimuthal.js
function d3_geo_azimuthal(scale, angle) {
  function azimuthal(λ, φ) {
    var cosλ = Math.cos(λ),
        cosφ = Math.cos(φ),
        k = scale(cosλ * cosφ);
    return [
      k * cosφ * Math.sin(λ),
      k * Math.sin(φ)
    ];
  }

  azimuthal.invert = function(x, y) {
    var ρ = Math.sqrt(x * x + y * y),
        c = angle(ρ),
        sinc = Math.sin(c),
        cosc = Math.cos(c);
    return [
      Math.atan2(x * sinc, ρ * cosc),
      Math.asin(ρ && y * sinc / ρ)
    ];
  };

  return azimuthal;
}

// https://github.com/mbostock/d3/blob/master/src/geo/azimuthal-equal-area.js
var d3_geo_azimuthalEqualArea = d3_geo_azimuthal(
  function(cosλcosφ) { return Math.sqrt(2 / (1 + cosλcosφ)); },
  function(ρ) { return 2 * Math.asin(ρ / 2); }
);
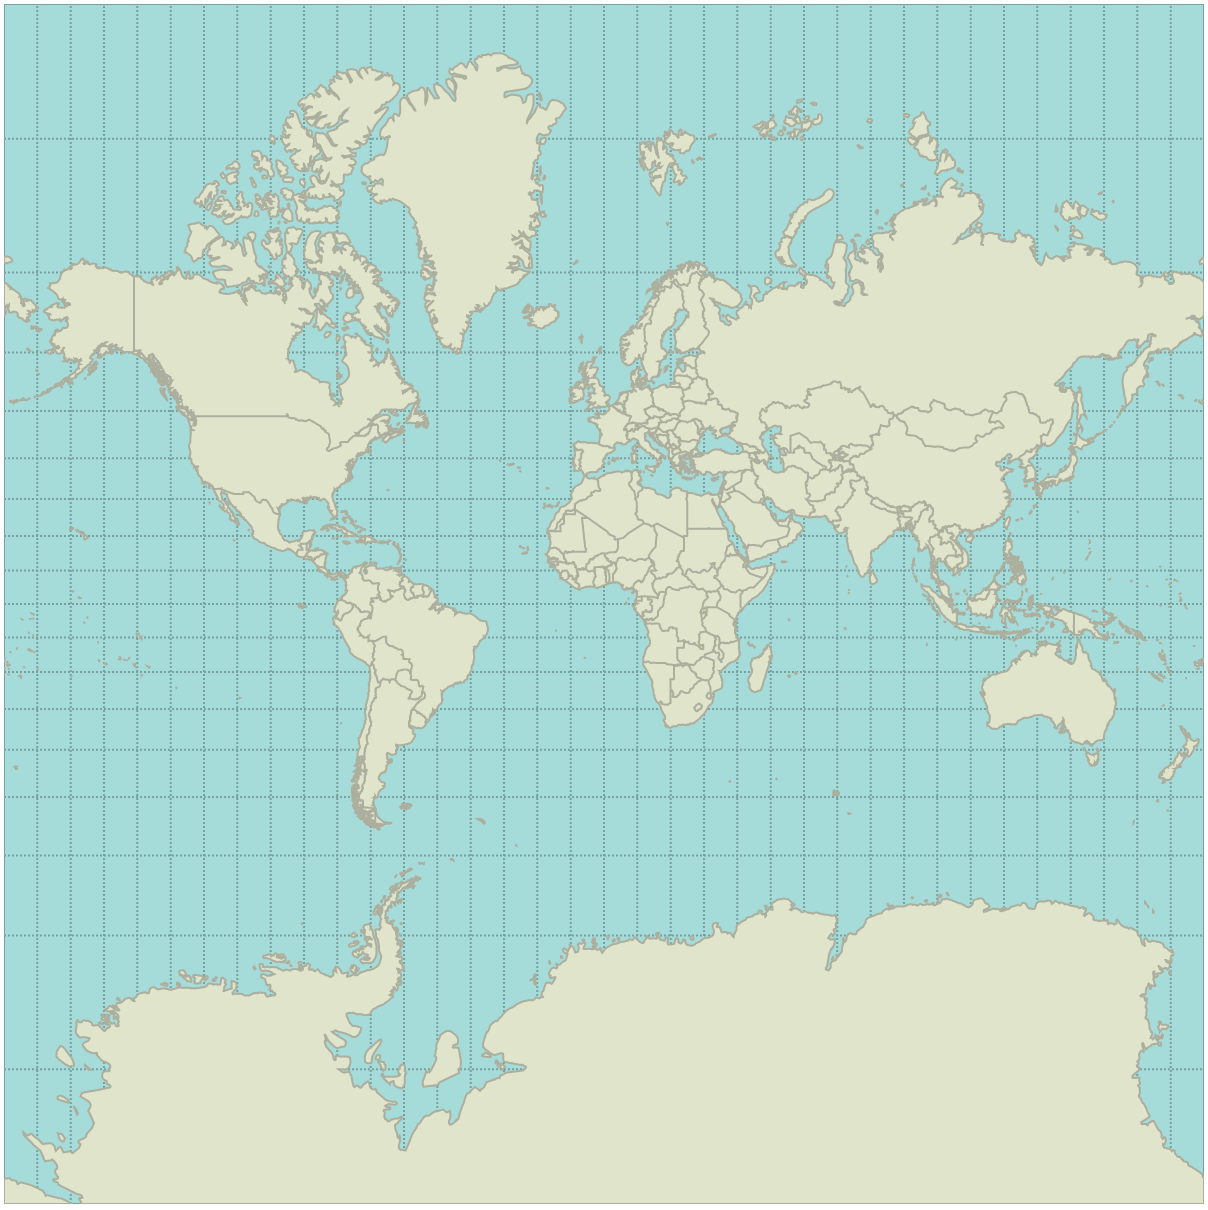
Mercator
function d3_geo_mercator(λ, φ) {
  return [λ, Math.log(Math.tan(π / 4 + φ / 2))];
}
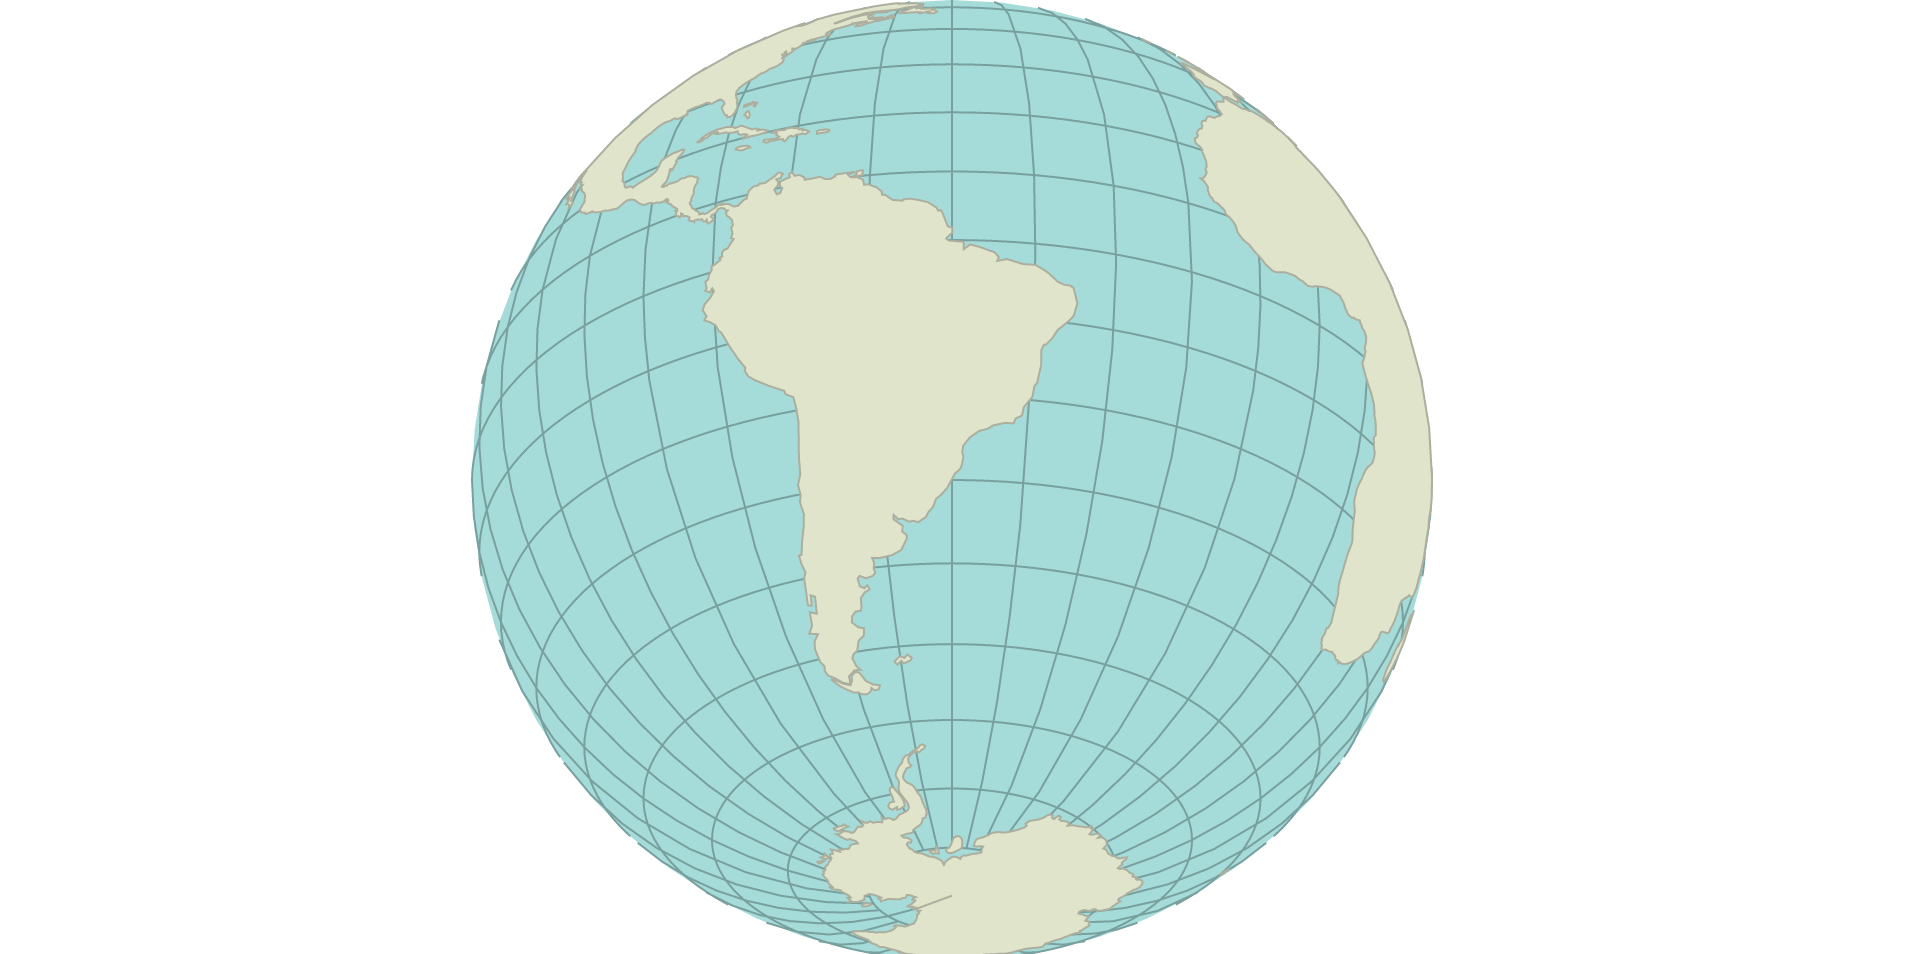
Orthographic
// https://github.com/mbostock/d3/blob/master/src/geo/orthographic.js
var d3_geo_orthographic = d3_geo_azimuthal(
  function() { return 1; },
  Math.asin
);
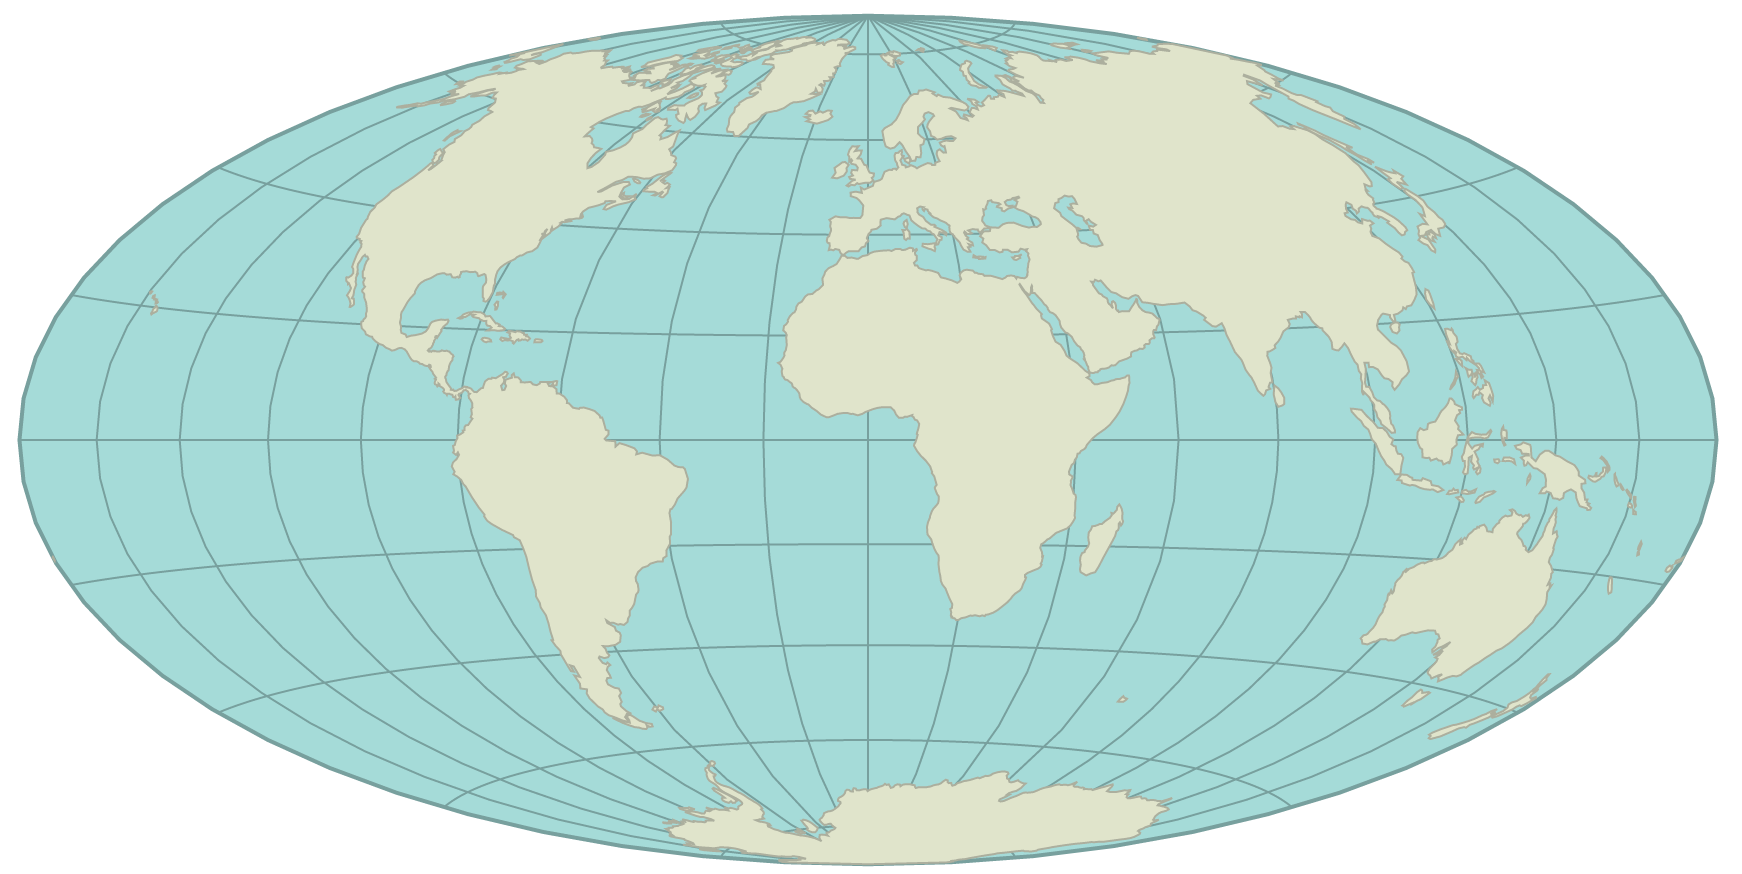
Hammer Projection (D3 Geo Projection Plugin)
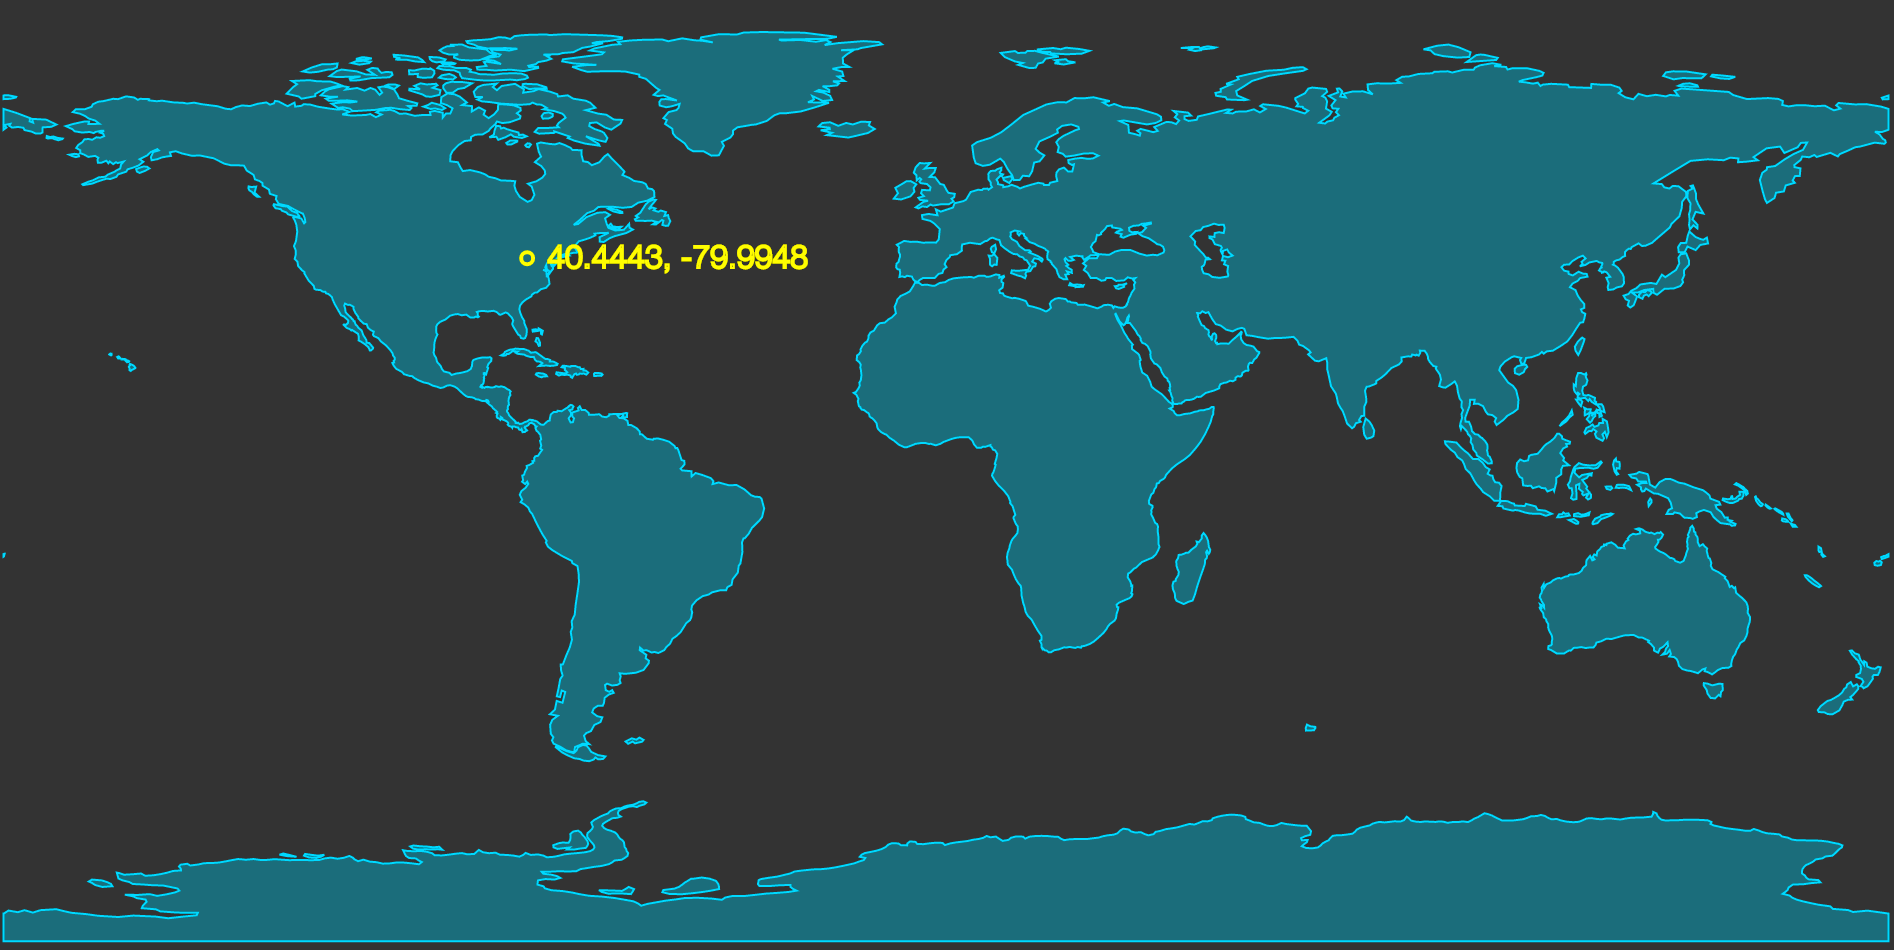
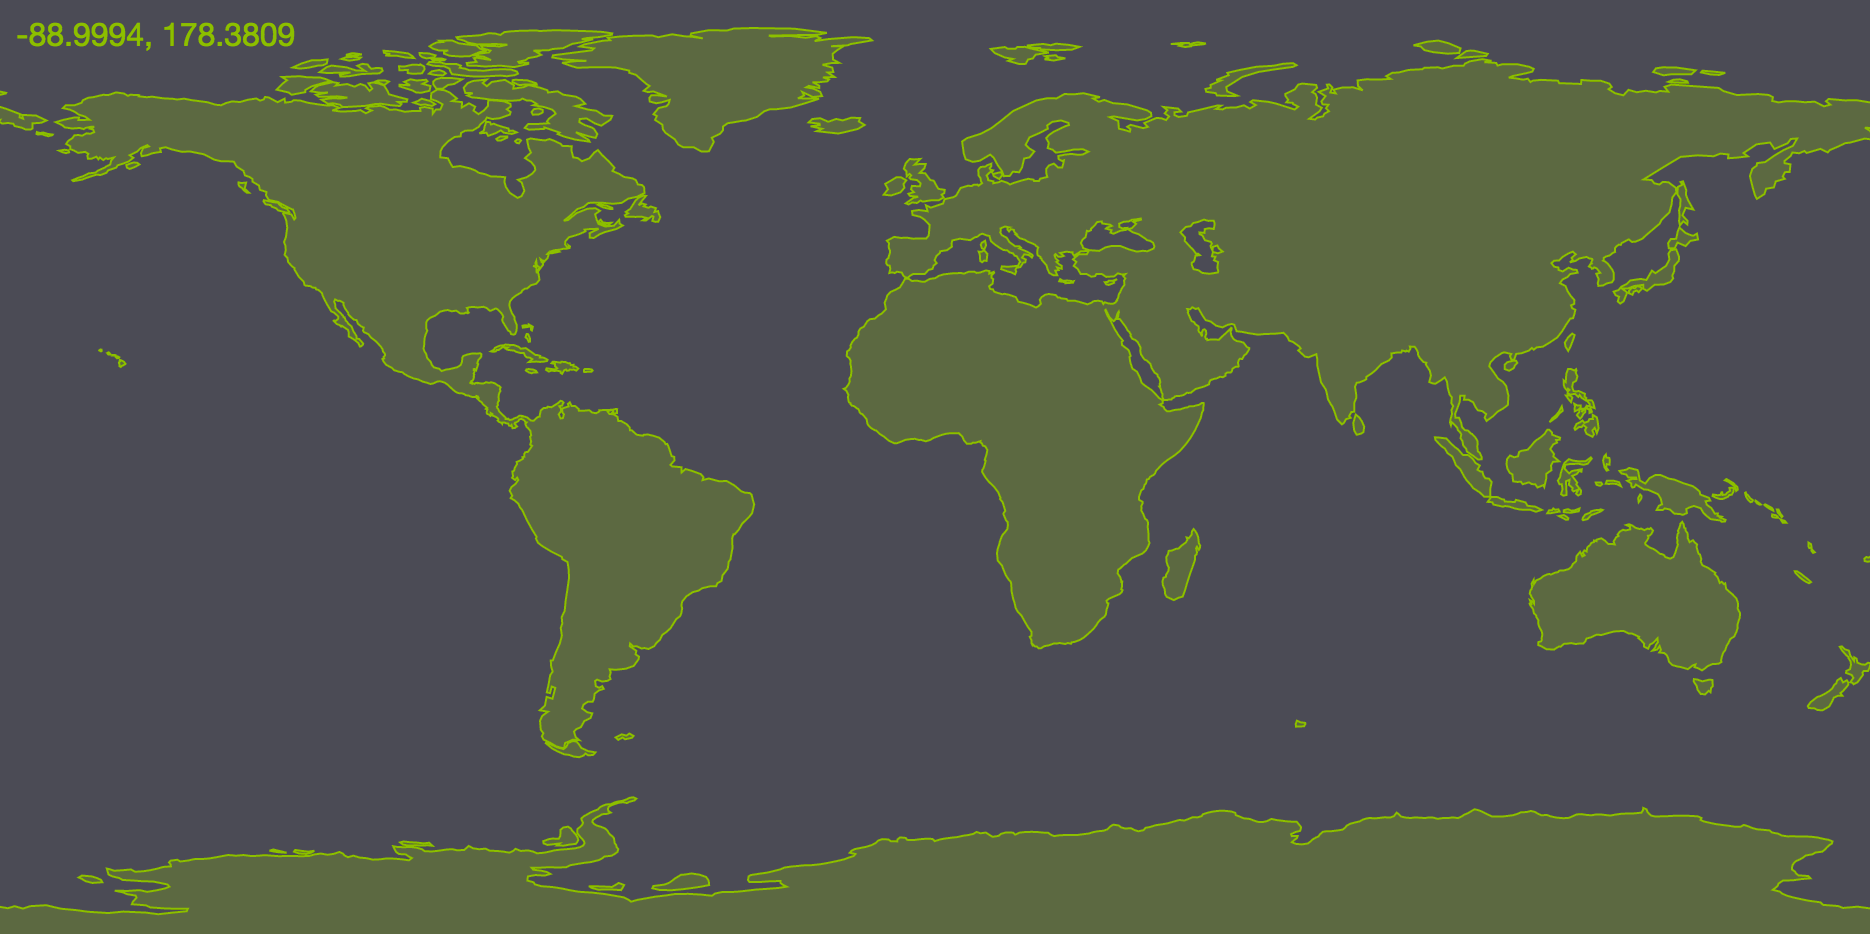
Projecting Points
Sometimes we won’t use the projection function to draw SVG paths, we can use the projections to project individual locations.
Using the Location API
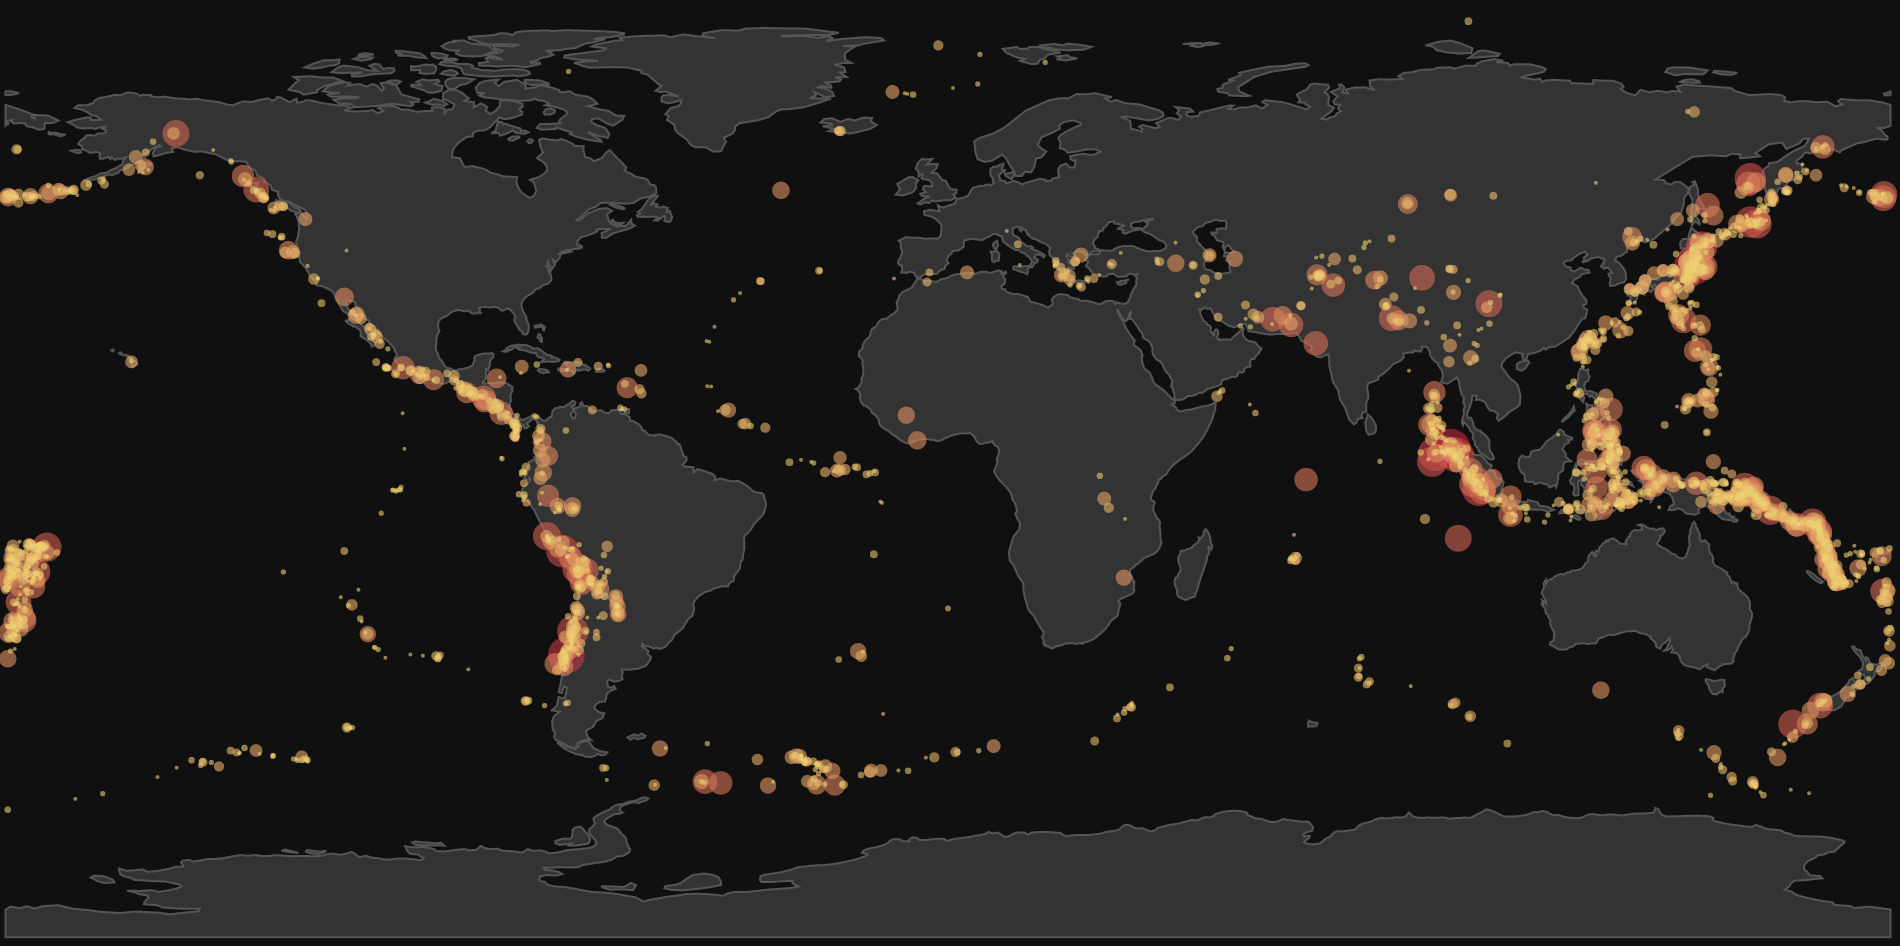
Earthquake Map
Centering and Scaling
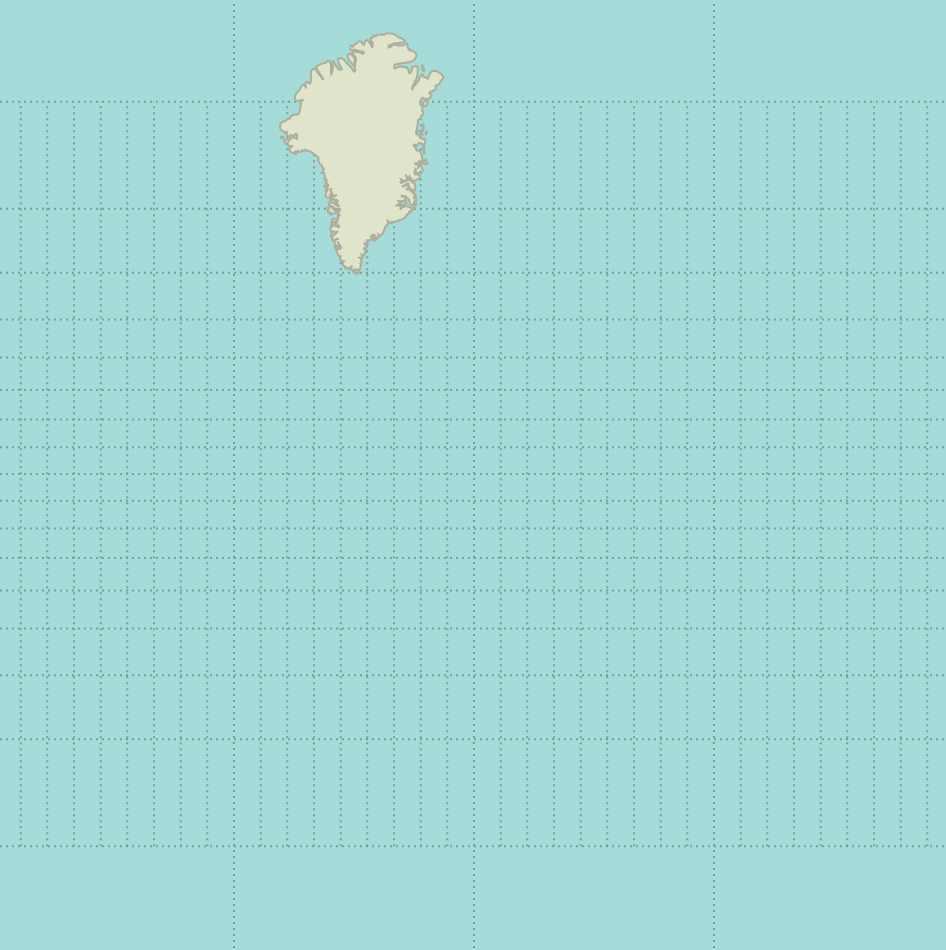
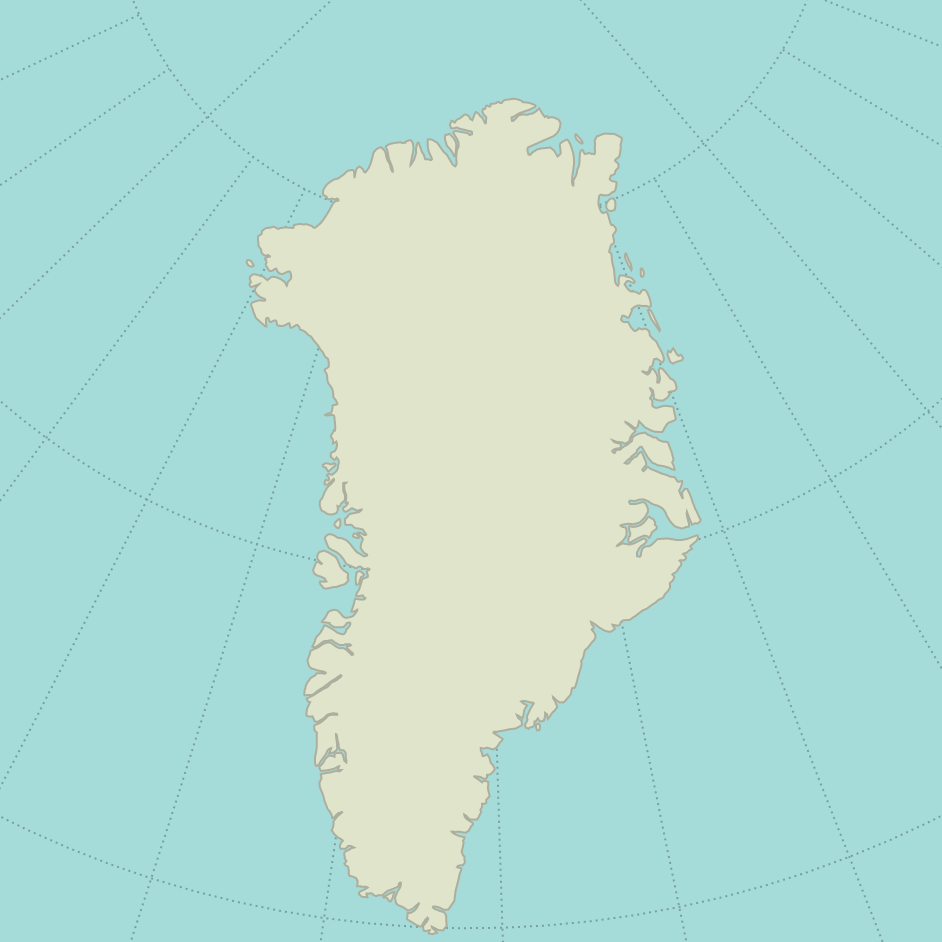
As you probably know, projections will distort aspects of Earth, sometimes quite seriously. The Mercator projection, for instance, was created in the 16th century to help navigation, as it preserves lines of constant course and angles with respect to meridians and parallels, it distorts the size of objects near the poles.
For instance, we usually see Greenland as in the image in the left, but in if we rotate the projection on the centroid of Greenland, we get something closer to reality (in relative size, that’s it)
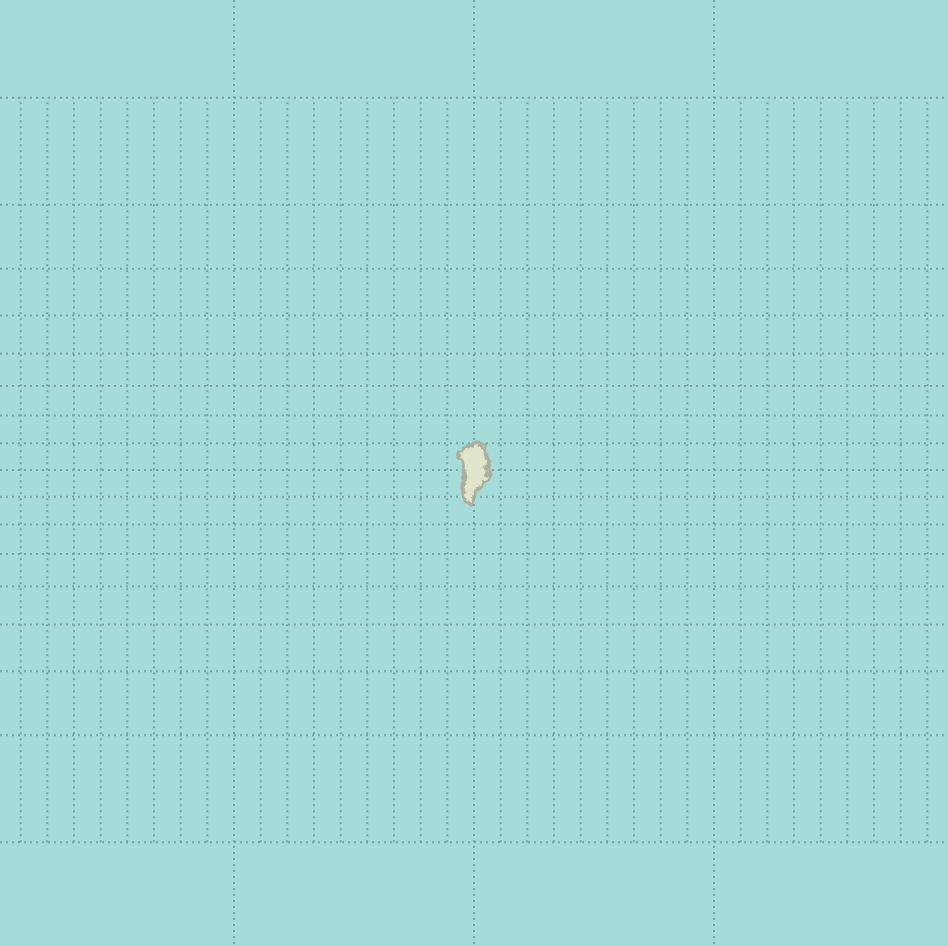
Other than the projections, D3 provides tools to compute attributes of geographic features, most of them are part of the spherical math module. These functions are useful to compute the centroid, area and bounds of features and use this to center or scale the projections.
Block: Greenland (Scaled and Centered)
Inverse Projection
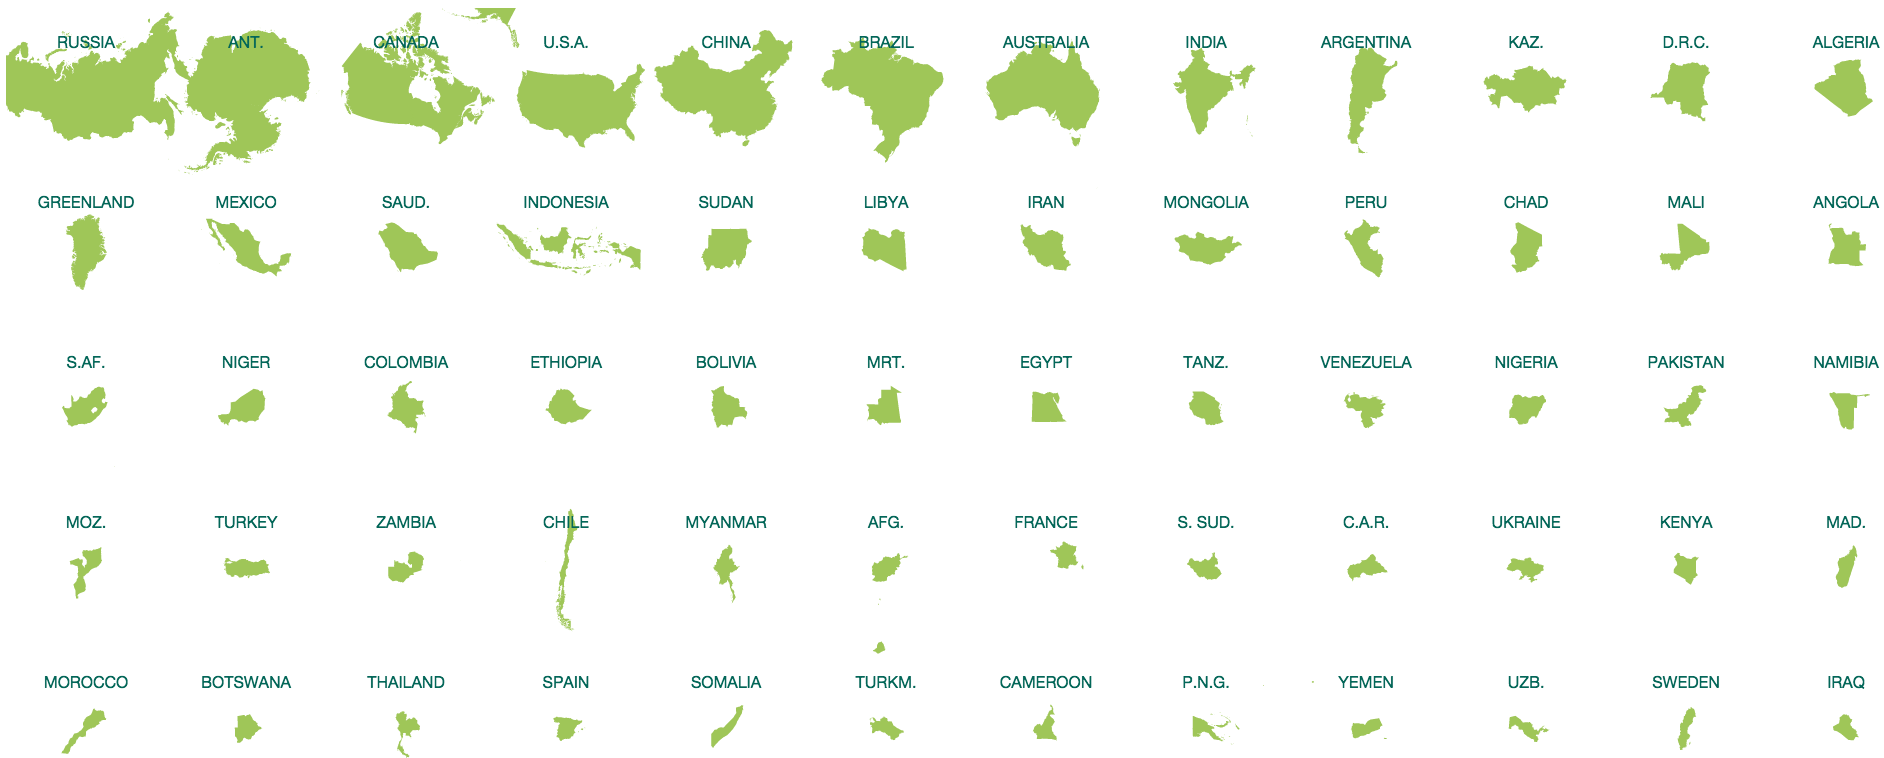
Countries by Size